With IPHost Network Monitor you can run WMI Thread Wait Reason monitoring of various devices in your network.
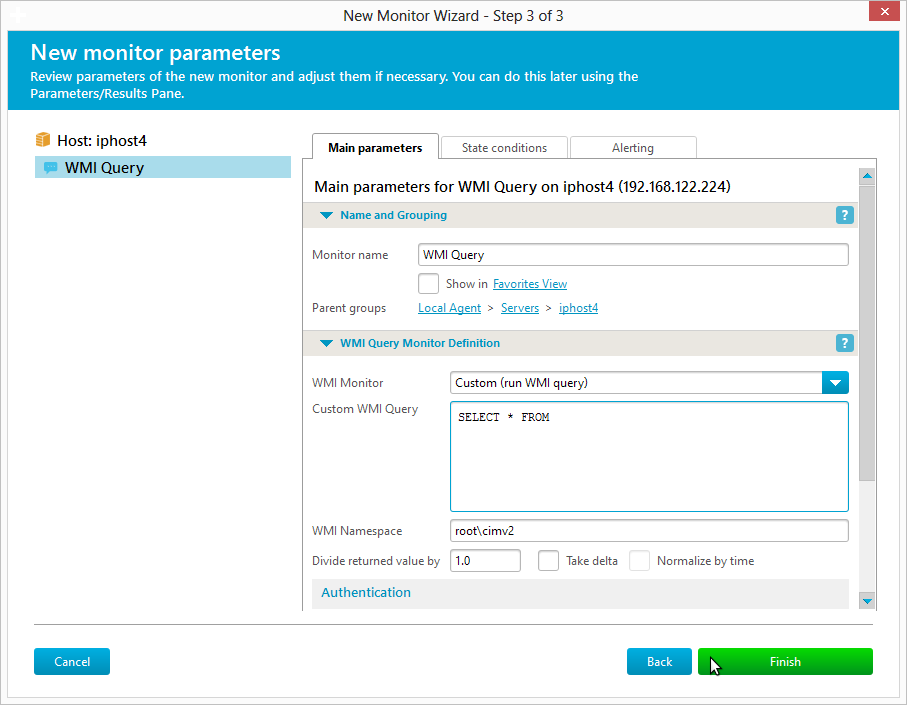
To create a WMI monitor for Thread Wait Reason, provide host name (it must be a Windows host) and specify custom WQL query:
Thread Wait Reason is only applicable when the thread is in the Wait state (see Thread State). It is 0 or 7 when the thread is waiting for the Executive, 1 or 8 for a Free Page, 2 or 9 for a Page In, 3 or 10 for a Pool Allocation, 4 or 11 for an Execution Delay, 5 or 12 for a Suspended condition, 6 or 13 for a User Request, 14 for an Event Pair High, 15 for an Event Pair Low, 16 for an LPC Receive, 17 for an LPC Reply, 18 for Virtual Memory, 19 for a Page Out; 20 and higher are not assigned at the time of this writing. Event Pairs are used to communicate with protected subsystems (see Context Switches).
The Thread performance object consists of counters that measure aspects of thread behavior. A thread is the basic object that executes instructions on a processor. All running processes have at least one thread.
IPHost Network Monitor is an advanced and easy tool for monitoring LAN and WAN networks, network servers, workstations and TCP/IP devices. Use IPHost Network Monitor to monitor your servers, domains, computers and devices.