State Conditions
Monitor states and state conditions
The following monitor states are defined in IPHost Network Monitor:
- Down
- Warning
- OK
- Unknown
- Stopped
- Stopped by Dependency
- Maintenance
- Discovered
Two of these states: Down and Warning are named problem states. The rules that define when a given monitor should switch to a problem state are named State conditions.
For example, the following state conditions can be defined for an SNMP Traffic monitor.
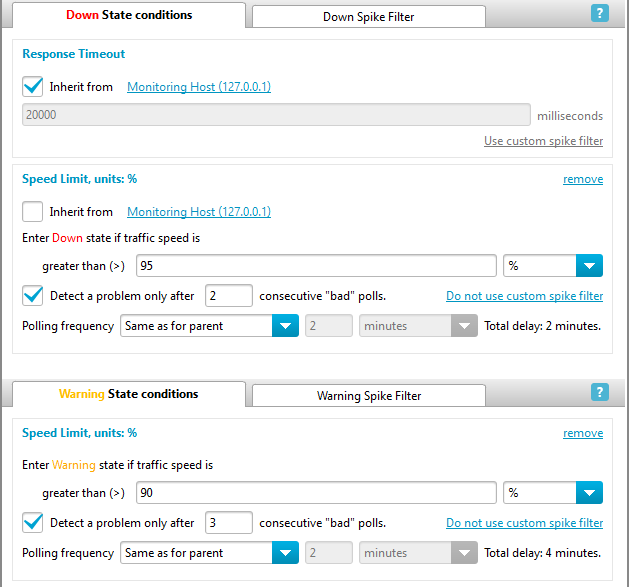
Down and Warning state conditions:
And common spike filter:
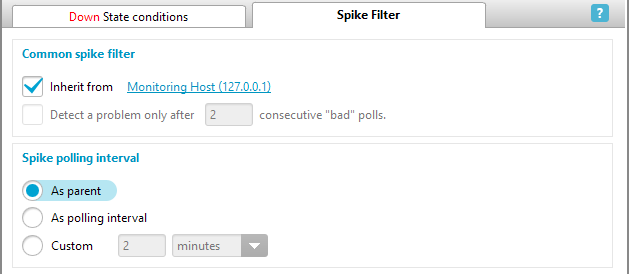
They specify that this monitor should
- switch to Down State if either:
- the second poll in a row (as specified in the Common spike filter) is timed out for more than 20 seconds (as indicated by the Response Timeout section for the Down state);
- the second poll in a row (as specified in the custom spike filter of the Speed Limit section for the Down state) returns more than 95% of the total bandwidth;
- switch to Warning State after the third poll in a row (as specified in the custom spike filter of the Speed Limit section for the Warning state) returns more than 90% of the total bandwidth.
The State conditions Tab in the Parameters/Results Pane is used to configure state conditions for any tree node in the Main view tab (that is, the All Agents root, a particular agent, host group, host, application or monitor). Objects other that monitors do not directly use their state conditions but rather allow their child objects to inherit them. The state condition configuration for a particular state consists of several sections, and each section contains a single rule, for example, a list of accepted values returned by the monitor. The sample state condition configuration above contains two sections for the Down state and one section for the Warning state.
The set of state condition sections available for a monitor depends on the monitor type. For example, a PING monitor state condition can contain only two sections:
- Down State Conditions: Response Timeout
- Warning State Conditions: Response Time Limit
whereas, an SNMP Custom monitor state condition can contain up to six sections:
- Down State Conditions: Response Timeout
- Down State Conditions: Value Bounds
- Down State Conditions: String Response Validation
- Warning State Conditions: Response Time Limit
- Warning State Conditions: Value Bounds
- Warning State Conditions: String Response Validation
If a monitor, application or host is copied, its state conditions are copied, too, since they are considered as a part of the monitor or host definition.
State conditions and inheritance
As for many other parameters, state conditions can be inherited. The Main view tree defines the inheritance path. You can define sections of any type for all types of tree nodes, except for monitors. For monitors, you can only define sections that are supported by a given monitor type, and only these section types will be shown if they are inherited. You can break the inheritance on any level and override section parameters, or just remove the section.
If a section is being added for a parent, it can be inherited by all its children. If a new section is added to a child’s state condition, and this section is already defined for the child’s direct parent, then the child inherits the parent section. After the inherited section is created you can turn off inheritance and modify the section if necessary. If this section is not defined for the parent, then an empty new section is created.
The parent’s sections are propagated to all its direct children. If a section is being added for a parent and a child has such a section, it will be replaced with the parent one (inherited) after showing a confirmation dialog where you can prevent the inheritance. Note that all the changes made to the parent section are automatically applied to all its children that inherit this section.
If a section is being removed from a parent and its children inherit such a section, a confirmation dialog would be shown where you can prevent deletion and ask to add a copy of parent section as a custom one to child.
The Enforce return to inheritance for children button on the State conditions Tab allows restoring the parent state conditions for all its children, either for direct ones, or for the entire children tree. Similarly to adding a new section for the parent tree node, any complex changes are summarized in a dialog and can be selectively canceled.
Spike filter
In order to prevent false alarms you can use Spike filter. If the filter is on, a monitor does not switch to a problem state after the first “bad” poll that satisfies the problem condition. The monitor will change its state only after a specified number of consecutive “bad” polls satisfy the condition. Note that in some cases the filter might mask an actual problem such as a resource frequently getting out of service for a short while.
Sections that support spike filter use the common spike filter settings for the down or warning state conditions. You can configure those settings on the Spike filter tab for down and warning state conditions. By default Spike filter is disabled.
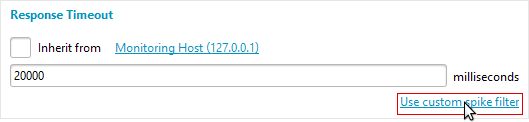
You can use custom spike filter settings for each section that supports the spike filter. Click ‘Use custom spike filter’ to override common spike filter settings. This is helpful if you want to configure a specific spike filter for a given section.
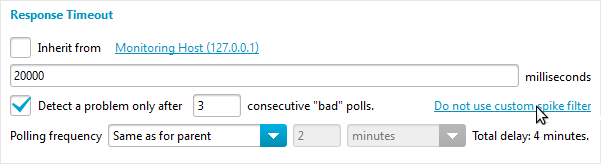
Click ‘Do not use custom spike filter’ to return to the common spike filter settings.
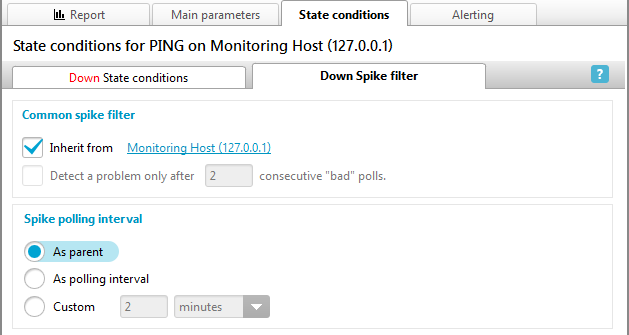
For example, if you want to skip certain transitions to Warning state by response time limit for PING monitor, you can disable common spike filtering and enable custom spike filter just for Warning Response Time Limit section.
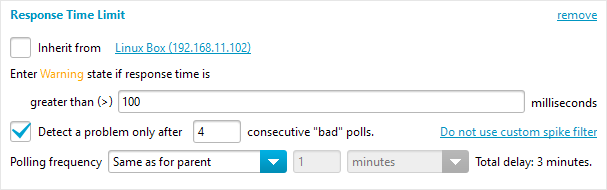
In the example above the PING monitor will not switch to the Warning state after a single poll is overdue (takes longer than 0.1s). The monitor will switch to the Warning state only after four polls in a row are overdue. If, for example, two polls are overdue and the third poll is OK, the monitor remains in OK state and spike counter is reset. So, now four “bad” polls in a row are necessary to switch to the Warning state again.
Spike filter interval
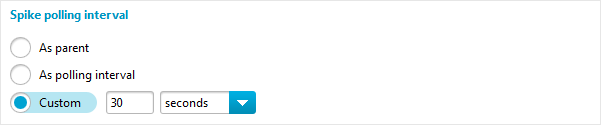
When Spike filter is on, in order to shorten or extend monitor’s polling interval during spikes, you can specify custom interval in the Spike filter tab. Like Polling interval, it is strongly recommended to set the Spike filter interval to longer than 15 seconds. Spike filter interval is used for all the spike filters of a given entity, i.e., all the spike polls for a given monitor use the same interval, regardless of a state condition section that has started spike polling. The interval could be configured either in a state condition section while you are configuring the section spike filter or on the Spike filter tab. This is how the Spike filter interval is configured on Warning Spike filter tab:
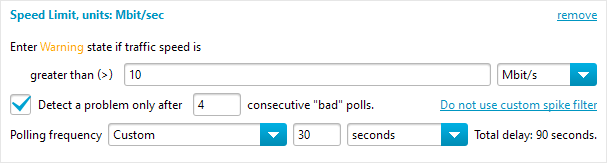
For example, the following warning state condition and spike filter interval section for an SNMP Traffic monitor specifies that the monitor will switch to the Warning State if the traffic speed remains higher than 10 Mbit/s for 4 polls in a row (1 “normal” poll and 3 additions “spike” polls). These additional 3 polls takes place every 30 seconds and a state change will occur after approximately 90 seconds. After the monitor’s state is changed or if the traffic speed drops below 10 Mbit/s between spikes, the monitor will be polled again once every 1 minute (using the Polling interval).
Supported state conditions
The following kinds of State conditions sections are available:
- Down State: Response Timeout
This is the only predefined section for the All Agents root tree node in the new installation. The sample section below is inherited from the monitor parent, and specifies that the monitor will switch to Down State if the second poll in a row is timed out for 20 seconds (note that Spike filter is on, and the additional “spike” poll will be done in 20 seconds after the first failed poll, as specified in “interval: 20 seconds” parameter).
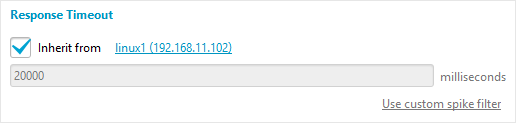

If Spike filter is off the monitor will switch to Down State immediately after a poll is timed out for 10 seconds. It is possible to set the time interval as a fraction of a second, for instance, 0.1.
- Warning State: Response Time Limit
The sample section below defines the condition for a monitor to switch to the Warning state if the response time for the second poll in a row exceeds 10 seconds (note that the Spike filter is on, and an additional “spike” poll will be performed 2 minutes after the first failed poll, as specified in the “interval: 2 minutes” parameter). If the Spike filter is off, the monitor will switch to the Warning State after the first poll time exceeds 10 seconds.
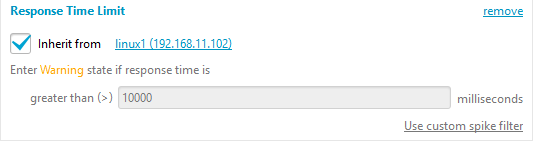
This section is useful for any monitor that reports its polling time as a performance value, for example, for a PING monitor. It is possible to set time interval as a fraction of second, for instance, 0.01.
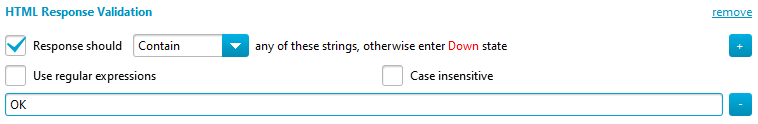
- HTML Response Validation
This section is used to validate a textual HTTP response for HTTP(S) monitors. The monitor will switch to Down or Warning State if a poll returns HTML data that violates the condition. The sample section below defines that the monitor will switch to Down State if the HTML response does not contain the ‘OK’ text string.
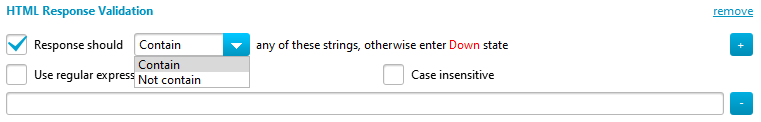
The section may contain not just one string but a list of text strings. If multiple strings are provided, the validation is succeeded if the response contains (or does not contain) any of the strings. To add another string, you should press the button with the plus sign:
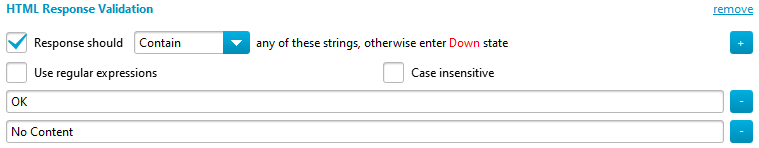
To remove a string from the list, use the button with the minus sign to the right of the string being removed.
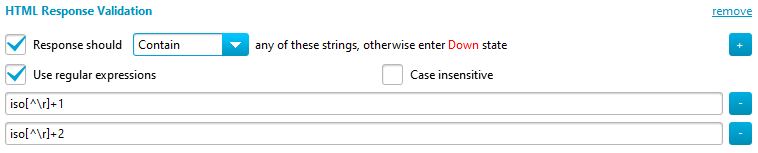
You may use regular expressions instead of strings:
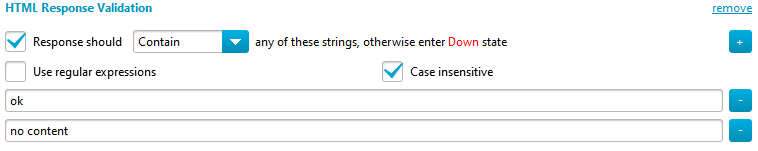
You may use case-insensitive comparison if you wish:
- HTTP/FTP Return Code Validation
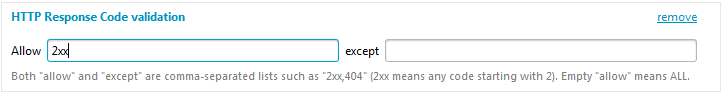
HTTP(S) and (S)FTP monitors allow to check a return code returned by the server. You can list all the codes that are acceptable, i.e., if the code returned by the server is in this comma-separated list, the monitor will not switch to a problem state. In this list you can use the notation like ‘3xx’ to specify any code starting with digit 3. E.g., the below section specifies that the monitor will be in the OK state if any return code starting with 2 is received:
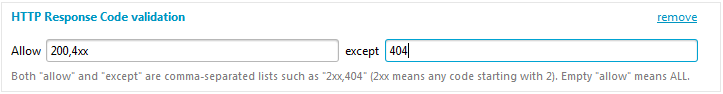
You can also specify a comma-separated set of prohibited response codes, i.e., exceptions for the accepted code list. If the server returns one of the prohibited codes, the monitor will switch to the problem state regardless of the same code being listed as accepted. E.g., for the below section the monitor will accept codes 200 or any code starting with 4 besides 404:
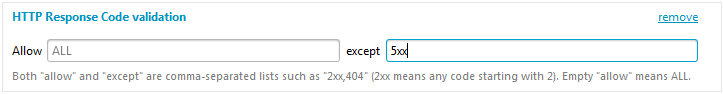
A blank list of accepted codes means any code is accepted. For the following section, the monitor will switch to the problem state only if the code returned by the server is starting with 5:
Note that HTTP Return Code Validation and FTP Return Code Validation are different kinds of sections. This means that you can specify different default return code validation settings for HTTP and FTP monitors at the host level or above.
- Value Bounds
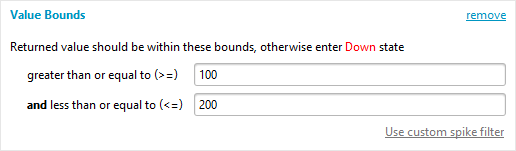
Some monitor types return a numeric performance value with some specific meaning (rather than reporting how long it took to do the poll). This value can be checked against the boundaries set in the Value Bounds section. In the sample below the monitor will switch to a problem state if the second poll in a row returns a number that is not within these bounds: [100…200]. An additional “spike” poll will be performed 2 minutes after the first failed poll, as specified in the “interval: 2 minutes” parameter.
If Spike filter is off, the monitor will switch to a problem state after the first poll that satisfies the condition.
This section can be used for SNMP Custom, Disk space, File, WMI Query, Databases, Script or Program, and Remote SSH monitors.
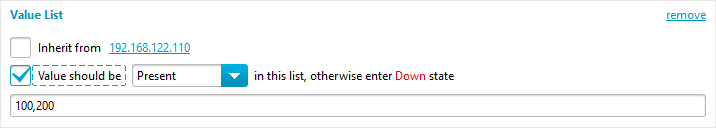
- Value List
This section applies to the same monitor types as in the previous chapter. Its meaning is also similar: a numeric performance value returned by the monitor can be checked against a comma-separated numeric value list. In the sample below the monitor will enter a problem state if a poll does not return 100 or 200.
This section can be used for SNMP Custom, Disk space, File, WMI Query, Databases, Script or Program, and Remote SSH monitors. Note that this section does not use Spike filter.
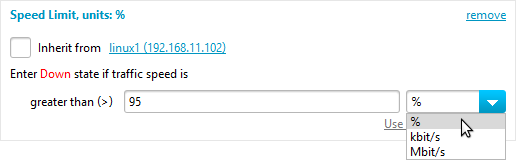
- Speed Limit
For both SNMP and WMI based Traffic Speed monitor types it is possible to set the upper speed limit for a monitored network interface. This will cause the monitor to switch to a problematic state, either Warning or Down after this limit is reached. The Traffic Speed monitor that uses the sample section below will switch to Down State after the second poll in a row shows that the traffic speed is greater than 95% of total bandwidth (note that the Spike filter is on, and an additional “spike” poll will be performed 20 seconds after the first failed poll, as specified in the “interval: 20 seconds” parameter).
- Volume Limit
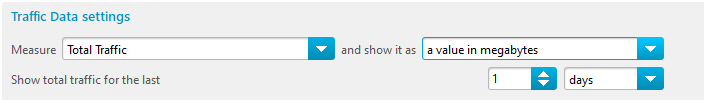
For both SNMP and WMI based Traffic Volume monitor types it is possible to set the upper traffic volume limit for a given time interval (summation period) for a monitored network interface. The summation period is defined in the traffic monitor settings section on the Main parameters tab:
You can indicate the limit using the Volume Limit section. This will cause the monitor to switch to a problem state, either Warning or Down, after this limit is reached during the summation period. The Traffic Volume monitor that uses the sample section below and the summation period above will switch to a Down State if the second poll in a row shows that the traffic volume for the last 24 hours exceeds 10Gb.
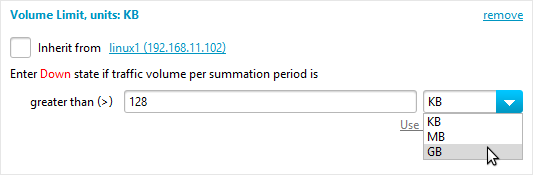
Note that in this sample the Spike filter is on, hence the monitor will switch to Down State only after the result of the second poll in a row satisfies this condition. An additional “spike” poll will be performed 2 minutes after the first failed poll, as specified in the “interval: 2 minutes” parameter.
- DNS Response Validation
If a DNS monitor is configured to return a request result (‘Get IP by hostname’ or ‘Get MX record for domain’), each of the returned values can be validated against a text string set specified in this section.
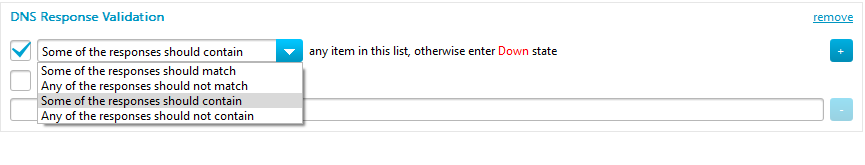
It is possible to check if each of the returned values matches exactly, does not match, contains, or does not contain the specified string. The DNS monitor that uses the sample section below will switch to Down State if none of the returned values (IP addresses) contains the ‘192.168.’ string.
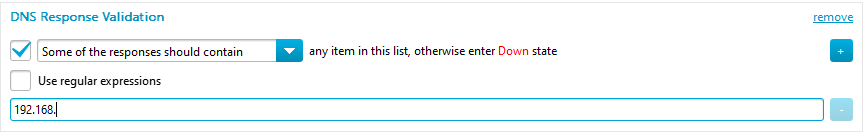
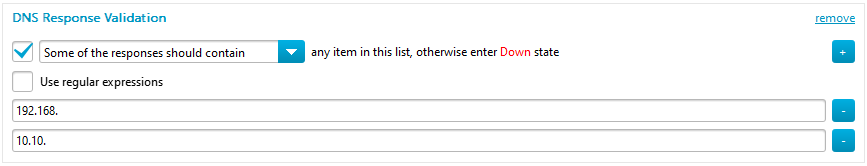
You can add or remove items from the list using the ‘+’/’-‘ buttons on the right:
You may use regular expressions instead of strings:
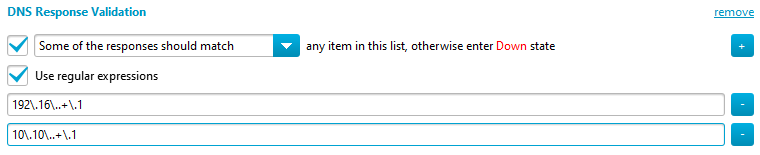
The case-insensitive comparison is used always for DNS results.
Note that this section does not use Spike filter.
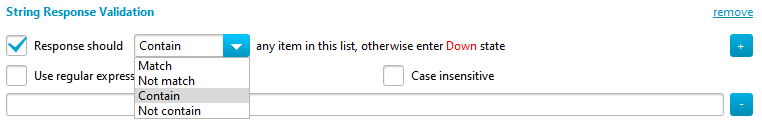
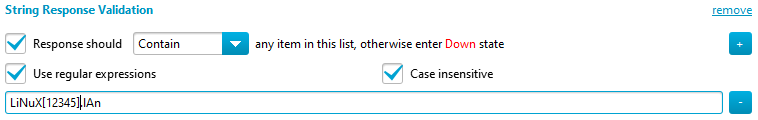
- String Response Validation
In “SNMP Custom”, “WMI Query”, “Script or Program”, “SSH (Remote Script or Program)” and “Python script” monitors the string response value can be validated against the value list set in this section. The sample section below defines that the monitor should switch to Down State if the value is not equal either to ‘linux1.lan’ or to ‘linux1.farm’.
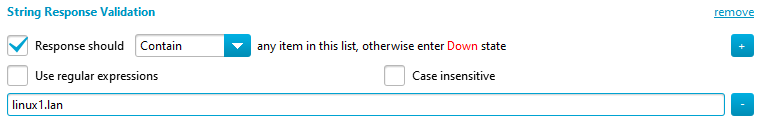
You can modify the list using the ‘+’/’-‘ buttons on the right, as below.
The first text string is added:
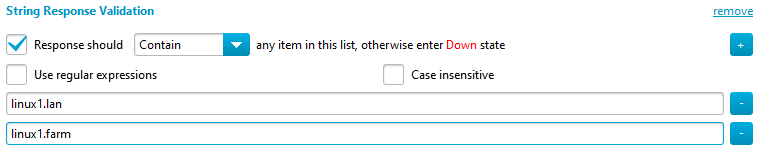
and now the second one:
You may use regular expressions instead of strings:
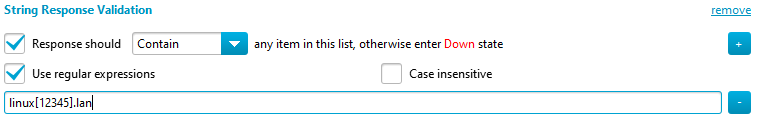
You may use case-insensitive comparison if you wish:
Note that this section does not use Spike filter.
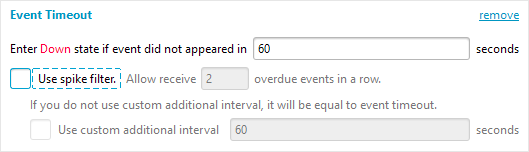
- SNMP Trap Event Timeout
This section is specific to the SNMP Trap monitor type. It allows tracking regular traps, such as a heartbeat trap. A monitor will change its state to Down if no trap is detected during the event timeout (60 seconds in the sample below).
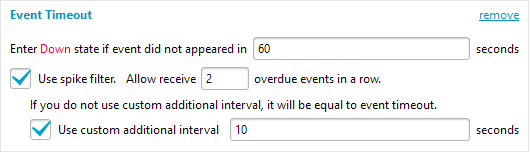
The monitor will change its state to OK immediately after the next trap is detected.
The spike filter allows an SNMP Trap monitor to remain in the OK state if several traps in a row are overdue. For example, if one or two traps in a row are overdue for less than the custom additional interval: 10 seconds (i.e. detected in less time than 60s + 10s), the monitor will remain in the OK state. If the third trap is overdue or missing, the monitor will change its state to Down.
- SNMP Generic Trap Payload
This section is specific to the SNMP Generic Trap monitor type. It allows to set up conditions which can cause monitor to switch to DOWN state on base of verification of a trap payload. A monitor will change its state to Down if defined payload either contain or not contain defined value.
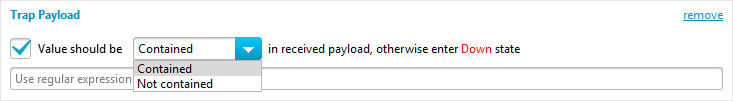
The value have to be defined using a regular expression. If the value field will be empty then this state condition will not be applied.